


1960-2019 By the Numbers: It Isn’t Rocket Science
Pure mathematics is, in its way, the poetry of logical ideas.
—Albert Einstein
Unprecedented Increase in Emissions
The history of manmade carbon dioxide (henceforth CO2) emissions begins around 1880 when industrialization began to ramp up and when global temperature record-keeping began. But the real story starts around 1960 when economic development in the Asia-Pacific region began to take off. Fully 80 percent of all manmade CO2 emissions ever produced have been generated since 1960, and half of all emissions have been generated just since 1990 – in the last 30 years. This will give you a sense of the stupendous increase in the rate of CO2 emissions that has occurred in the past 60 years.
Feelings v Facts
And emissions are still increasing. In the time it will take you to read this article, another 7,600 tons of CO2 will be released into the atmosphere – that’s a rate of 760 tons a minute or 12 ½ tons per second! I make this point to emphasize the sheer size of the problem. Unfortunately, once numbers cross the threshold of what we were evolved to deal with intuitively (a few hundred perhaps), they become abstract and the imagination can’t grasp them. But the rational mind can, and that’s why we need to use our intellect rather than our feelings when thinking about this problem. But this is very tough to do because the finality of the nature of the existential threat is frightening and so it is natural to want to dismiss or downplay it.
It Isn’t Rocket Science
Climate science is a complicated subject because it deals with, among many other things, thermodynamic flow. Thermodynamic flow is a phenomenon that has always taxed the simulation capabilities of even the most sophisticated computers. But the core cause and effect mechanism is not complicated. Here it is:
- The Earth is heated by the Sun.
- For the Earth to stay at the same temperature, it must give off as much heat as it absorbs.
- Carbon dioxide traps heat trying to leave, so the Earth gives off less heat than it receives.
- This makes the Earth get hotter.
- The Earth will keep getting hotter until it once again gives off as much heat as it receives.
- We keep putting more carbon dioxide into the air, so the Earth keeps getting hotter.
- The Earth will keep getting hotter until we stop.
- Even after we stop, the carbon dioxide already in the air will continue to warm the planet for centuries.
- If we keep going like this, the Earth will get too hot for life to survive.
- This could happen surprisingly quickly.
Now let’s take a look at the numbers. The most important factors are CO2 emissions, atmospheric CO2 concentration, and global temperature. Emissions cause the concentration of CO2 to increase, and as the concentration of CO2 increases, the global temperature goes up.
Emissions
This graph shows annual CO2 emissions for the past 60 years:
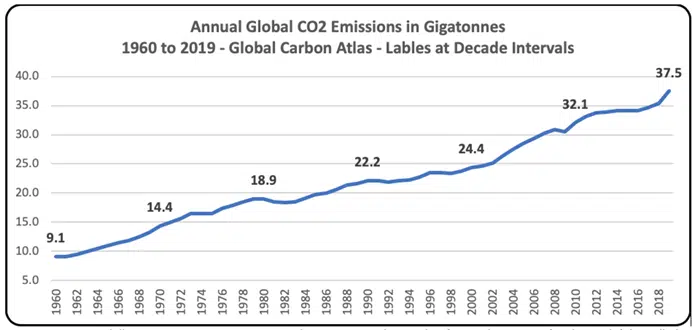
Between 1960 and 2019, annual emissions increased by 28.4 gigatonnes. This amount is a fourfold increase. Half of these emissions were released between 1960 and 1998 (38 years) and the other half were released between 1998 and 2019 (21 years). The acceleration is evident by the rising slope of the curve in the graph. Two thirds of this acceleration was due to a rapidly expanding energy market in China.
Concentration
This graph shows the annual average atmospheric CO2 concentration for the past 60 years.
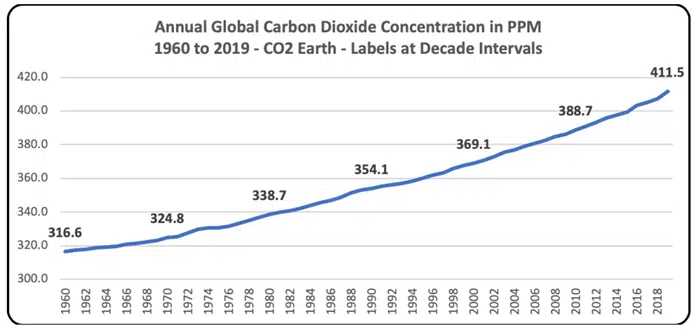
Between 1960 and 2019, atmospheric CO2 concentration increased by 94.9 ppm. As in the case with emissions, half of the concentration increase occurred between 1960 and 1998, and the other half between 1998 and 2019. As expected, both are tracking together since there is an established linear relationship between CO2 emissions and CO2 concentration.
Temperature
This graph shows the annual temperature anomaly. An temperature anomaly is an unusual deviation from the norm caused by manmade CO2 and other greenhouse gases. The deviation is measured from a baseline – the average global temperature between 1951 and 1980.
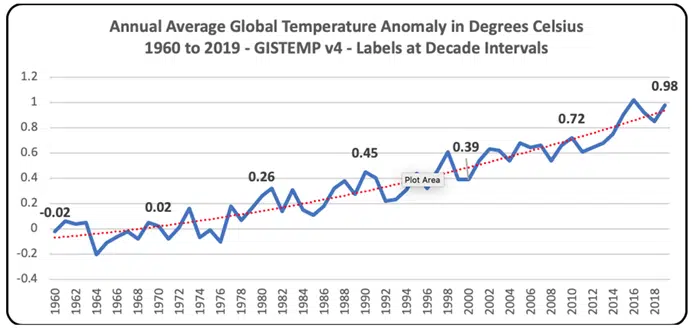
The average annual global temperature oscillates, but as you can see from the red trendline, it is steadily increasing. Note that the temperature anomaly has risen by almost one degree since 1970. (On the graph, 1970 is where the blue line crosses the zero on the vertical axis.)
This temperature rise is often described as the increase over the pre-industrial average. This might reasonably lead you to believe that it has taken since 1880 to climb this high, but that isn’t the case. The increase has occurred just since 1970. The reason for this is that, as the next graph shows, the global temperature declined in the first two decades of the 20th century before beginning a slow recovery.
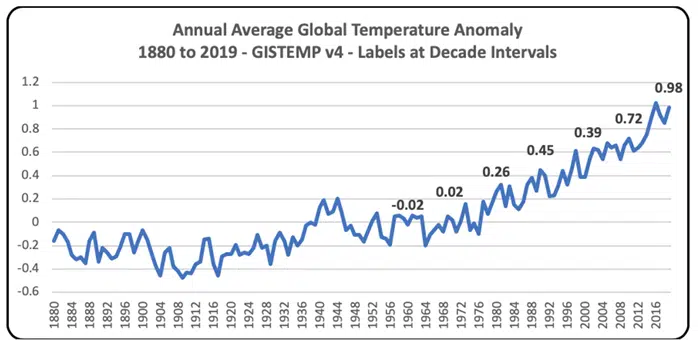
The temperature did not recover to the pre-industrial average until 1970. That’s why the entire temperature increase above the pre-industrial average is due to the temperature increase since 1970. It didn’t take 140 years (since 1880), but only 50 years (since 1970). That’s much faster than most people realize.
Emissions v Temperature
The next graph plots emissions together with the temperature anomaly. (Note that the temperature anomaly has been multiplied by 50 so that it fits on the same scale as emissions.)
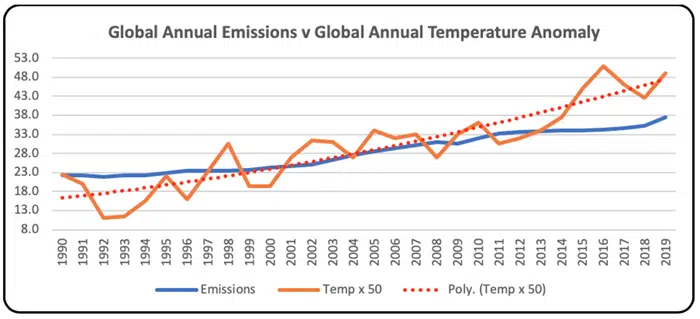
Before the year 2000, emissions were increasing faster than the temperature. By 2000, temperature had caught up with emissions and matched it for the next several years. This is where the dotted red temperature trend line is superimposed on the blue emissions line. But by 2007 the temperature began to increase faster than emissions, and it has been leading emissions ever since.
One possible explanation for this is that it takes 40 years for the effects of emissions to fully manifest themselves. The year 2000 is 40 years after 1960 when emissions really started to take off. What may be happening is that the global temperature is now being forced, not only by record high new emissions, but also by record high residual effects from prior emissions as well. If this is true then, given how fast annual emissions have increased during the past 60 years, the impact on future temperature increases could be substantial.
It is this accelerating rate of acceleration, whether from the residual heating of past emissions or from reaching tipping points, that has climate scientists worried, because it could change the situation dramatically in a relatively short period of time. The geological record shows that it has happened many times in the past. For example, as the planet emerged from the last glacial period, seas rose by 15 to 20 feet per century for many centuries. This is why, when speculating about climate change, it is best to expect things to be worse than you think faster than you think.
Recap
Over the past 60 years we have moved into extremely dangerous territory climatologically speaking. Cumulative emissions increased by 1,370 gigatonnes or a whopping 462 percent increase over all previous emissions. Carbon dioxide content in the atmosphere increased from 317 ppm to 412 ppm, putting us well over the danger threshold of 350 ppm. And the global temperature rose by one degree Celsius, leaving only ½ of a degree left before we reach 1.5 degrees, the point at which scientists tell us that grave consequences will ensue.
We are now at high risk of the planet continuing to heat regardless of what we do because we are getting closer and closer to the tipping point when our ability to influence events ceases and the planet continues to warm spontaneously as a result of the cumulative effects of our past actions. Indeed, we may have already exceeded the tipping point. We don’t really know, but what we can be certain of is that if we follow the track we are now on and continue to burn more and more fossil fuels, the nightmare scenario that none of us wants will come true, and it will happen sooner than we think.