


Earth’s Energy Imbalance: The Number to Watch

Earth System Science Data (ESSD) is an international, interdisciplinary journal for the publication of articles on original research data with the goal of furthering the reuse of high-quality data of benefit to Earth system sciences. Recently it announced the first publication of a comprehensive Earth Energy Imbalance (EEI) report led by Karina von Schuckmann, an oceanographer specializing in ocean climate monitoring.
The report was prepared by more than 30 researchers from scientific institutions around the world who tracked and quantified global heat distribution from 1960 to 2018. The team found that during 1971 to 2018, 89% of the heat went into the ocean, 6% to warming the land, 4% to melting ice, and a mere 1% to warming the atmosphere. With its enormous heat capacity, the ocean dominates the Earth’s heat inventory and keeps the atmosphere and the surface of the planet from burning up.
The amount of heat the Earth receives and gives off is measured in Watts per square meter of the surface of the Earth, abbreviated W/m2. Before industrial activity began putting greenhouse gases into the atmosphere, the heat in and the heat out at the top of the atmosphere were in balance, keeping the temperature of the Earth reasonably stable since the end of the last Ice Age some 10,000 years ago.
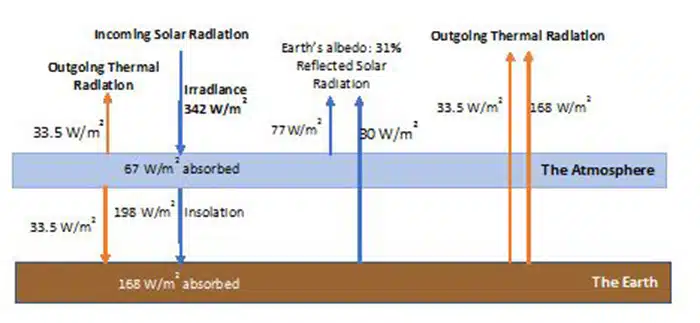
The preceding chart shows the flow of heat when the energy reaching the Earth and leaving the Earth were in balance. The blue arrows represent solar radiation and the orange arrows represent thermal radiation. When solar radiation heats up the Earth and the atmosphere, they emit thermal radiation. Solar radiation has a shorter wavelength than thermal radiation. Greenhouse gases are transparent to solar radiation because of their shorter wavelength, so they pass through unaffected, but these gases block some of the thermal radiation coming from the Earth because they scatter the longer wavelengths. A normal amount of greenhouse gases keeps the planet warm. It is the excess greenhouse gases produced by humans that is blocking too much thermal radiation from escaping to space and causing the planet to heat up.
We’ll begin with the blue arrows on the chart. It all starts with incoming solar radiation shown on the upper left part of the chart. After traveling 93 million miles from the sun, the average amount of solar radiation reaching the Earth (counting day and night) is 342 W/m2. The atmosphere absorbs 67 W/m2 and reflects 77 W/m2 back to space. The remaining solar radiation reaches the surface of the Earth where 168 W/m2 are absorbed and 30 W/m2 are reflected back to space. This accounts for the solar radiation.
Now for the orange arrows. The solar 67 W/m2 of solar radiation absorbed by the atmosphere is converted into thermal energy which is scattered with one half going back into space and one half going down to the surface of the Earth where it is absorbed (left side of chart). On the right side of the chart the 33.5 W/m2 of thermal energy and the 168 W/m2 of solar energy absorbed by the surface of the Earth are reradiated back into space in the form of thermal energy. The total value of the downward pointing arrows equals the total value of the upward pointing arrows, so everything is in balance.
Back to the EEI report. The researchers found that for the period studied, there was an energy imbalance of 0.47 W/m2. It also found that for the period 2010 to 2018 the energy imbalance was 0.87 W/m2, which means that the energy imbalance is increasing. These may seem like pretty small numbers to cause such a furor, but not when you consider the surface area of the Earth – a whopping 510 trillion m2. To calculate the total amount of energy reaching the Earth in one year we multiply the amount of energy received per square meter times the surface area of the Earth times the number of hours in the year. Let’s take the imbalance between 2010 and 2018 (0.87 W/m2).
The calculation gives us 222 million Terawatt-hours, which is the total amount of energy that the Earth received in a year and didn’t radiate back to space. By comparison, global energy production by humans in 2019 was 186,000 Terawatt-hours, less than one tenth of one percent of the solar energy the Earth received but didn’t emit back into space. The way that James Hansen expressed it was in terms of the number of Hiroshima-size atomic bombs going off each day. He was looking at 2005 to 2010 and his number was 400,000 bombs per day. Looking at the 2010 to 2018 period, the number is up to 600,000 bombs per day for the entire decade. That is an enormous amount of energy for a difference of just 0.87 W/m2.
Now let’s look at the heat balance chart again but with this adjustment.
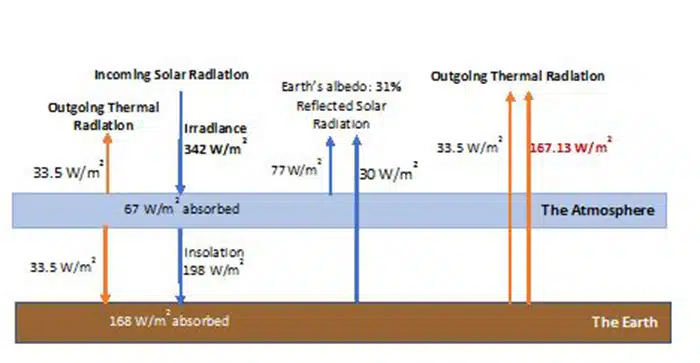
The change is so small compared to the overall picture that I highlighted it in red. The 0.87 W/m2 energy imbalance has been subtracted from the 168 W/m2 outgoing thermal radiation from the surface of the Earth leaving 167.13 W/m2. As you can see, it only takes an astonishingly small change in the energy balance to have a massive effect on the biosphere.
To summarize, I paraphrase James Hansen in his recent newsletter (which you can find here):
“Typically we use the atmospheric carbon dioxide concentration and global surface temperature to measure the severity of climate change, but Earth’s Energy Imbalance is more indicative of what is happening because it takes into consideration not just carbon dioxide emissions, but all the factors causing the planet to heat up, including some, like human-made aerosols, that are poorly measured. Earth’s energy imbalance will be our guide during the next several decades as we work to restore a healthy climate for future generations. It deserves greater attention. Karina von Schuckmann has become perhaps the world’s leading expert on this subject.”
Special thanks to James Hansen and Karina von Schuckmann.