


Sweating Out The Infection: How Climate Change Will Affect Population & Emissions

Greenhouse gas emissions are primarily driven by population. The more people, the more energy consumed; the more energy consumed, the more emissions. The UN has three population forecasts, high, medium, and low. The high forecast is unlikely because fertility rates have been dropping since 1946. The medium forecast predicts 10.88 billion people by 2100, the low forecast, 7.32 billion. Neither forecast considers the impact of climate change. By 2100, temperatures will be 3 to 5 degrees Celsius higher than the preindustrial level (we are already one degree higher), and a 2018 study reported in PNAS (the Proceedings of the National Academy of Sciences of the U.S.) predicts that sea level will be at least six feet higher. These and other effects of climate change will have a profound effect on the human population.
The following chart shows a population scenario which includes the impact of climate change. The chart shows the population for developed and developing countries.
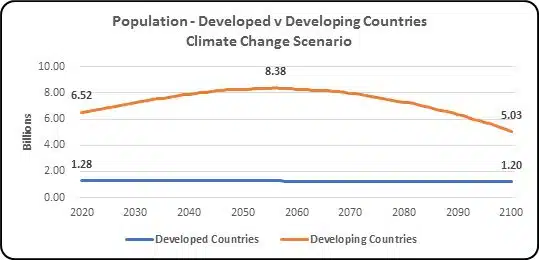
Some points to note: More than eighty percent of the world’s population is in developing countries. All the growth and subsequent decline in population will be in developing countries. The UN medium forecast already predicted a slight reduction in the population of developed countries. This scenario includes another 6% reduction.
Climate change is too complex to permit the computation of detailed forecast like this, but even if the numbers aren’t provable in detail, the general arc of population change is reliable because it is based on reasonable inferences derived from current facts, including: the rate of global warming is accelerating, the rate of ice melt is accelerating, we will continue to emit CO2 and other greenhouse gases in copious amounts for the foreseeable future, and we can’t roll out renewables fast enough to make a difference.
The next chart compares global population forecasts for the UN medium and low scenarios with the climate change scenario.
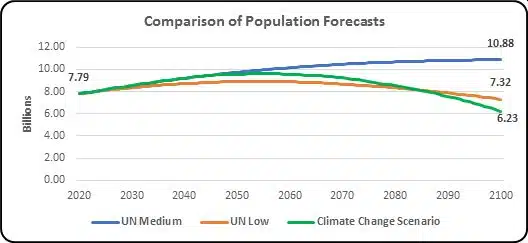
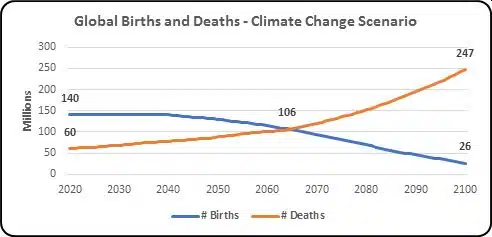
The UN low scenario envisions a reduction in the fertility rate throughout the century. The climate change scenario envisions population growth until mid-century before an accelerating decline as global climate conditions worsen. The birth rate will fall and the death rate will climb, as the following chart shows.
PER CAPITA ENERGY CONSUMPTION
The other factor that determines how much energy the world uses is annual per capita energy consumption. The following chart shows a forecast of per capita energy consumption by developed and developing countries under the climate change scenario.
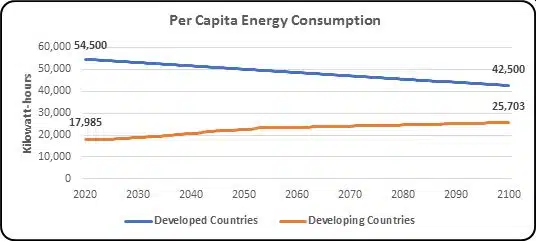
Per capita consumption by developing countries is currently on average one third less than that of developed countries. Per capita energy consumption for developed countries is assumed to decline by 22% by 2100. Per capita energy consumption for developing countries is assumed to rise by 25% by 2050 and then rise by another 14% by 2100, ending at about 60% of that of developed countries.
The reason for the continued rise in the per capita consumption of developing countries after 2050 is that the poorest countries with the lowest per capita energy consumption will be affected earliest and most severely. This will cause average per capita energy consumption to rise.
TOTAL ENERGY CONSUMED
The following chart shows energy consumption under the climate change scenario.
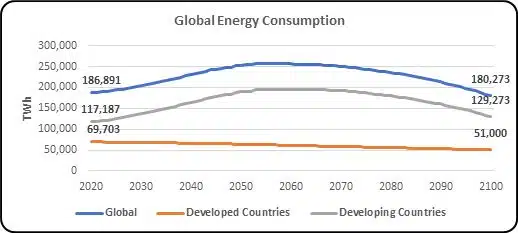
Global energy consumption under the climate change scenario is 180,273 TWh. The EIA forecasts that global energy consumption in 2050 will be 266,835 TWh. British Petroleum (BP) forecasts that global energy consumption in 2100 will be 343,000 TWh. By combining these two forecasts (the EIA/BP forecast) we have a forecast that spans 2020 to 2100. The following chart compares the EIA/BP forecast to the global energy consumption forecast under the climate change scenario.
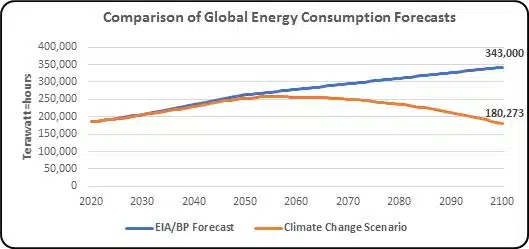
By 2100, the effects of climate change on the population will reduce global energy consumption by 50% compared to the EIA/BP forecast.
NUCLEAR AND RENEWABLES
We subtract nuclear and renewable energy from total energy to get energy from fossil fuels.
- Nuclear: The EIA forecasts that nuclear output will fall by 14% by 2050 while the rest of the world will increase by 50%. If U.S. policy changed in 2050 and it expanded its nuclear power capability in line with the rest of the world, by 2100 we could increase global nuclear output by another 83%.
- Renewables: The EIA forecasts that renewables will grow 244% by 2050, reaching 58,841 Terawatt-hours (TWh). If that growth rate continues, renewables will increase by 400% by 2100.
The following chart shows total energy production by nuclear and renewables from 2020 to 2100 using these assumptions.
FOSSIL FUELS
The next chart combines total energy consumption per the EIA/BP forecast with its fossil fuel and nuclear/renewables components assuming no adjustment in the UN population forecast.
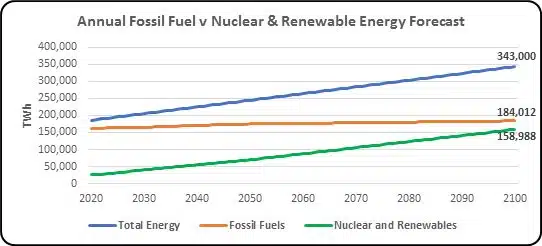
In this scenario, by 2100, nuclear and renewables output begins to approximate fossil fuel output, but growing demand causes fossil fuel use to still increase by 15%. The next chart shows total energy consumption using the population adjusted for climate change.
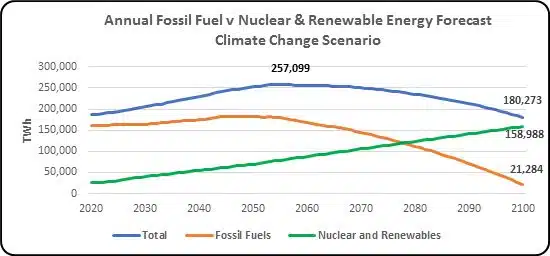
Energy demand peaks in 2057 at 257,099 TWh and nuclear and renewables output overtakes fossil fuel output in 2089. Nevertheless, by 2100, the world is still generating 21,284 TWh of energy from fossil fuels.
CARBON DIOXIDE EMISSIONS
Coal, oil, and natural gas emit different amounts of CO2 to produce the same amount of energy, so in order to calculate emissions, we need to know how much of each we are using. Between 2020 and 2050, the ratio of these fuels is expected to remain relatively constant – 40% oil, 30 % coal, and 30% natural gas. Assuming these ratios remain unchanged through 2100, emissions are easily calculated. The following chart shows annual emissions with and without the climate change population adjustment.
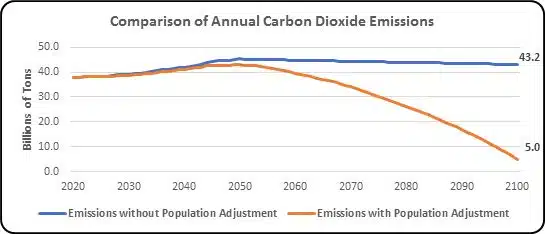
The difference in annual emissions is dramatic. By 2100, annual emissions with the population decline due to the impact of climate change is down to 5 billion tons, just 12% of the emissions under the EIA/BP forecast. The following chart compares cumulative emissions under the two scenarios.
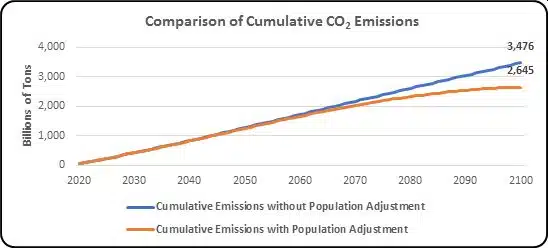
Despite the fact that annual emissions fall by 88% by 2100, the difference in cumulative emissions is only 25%. This is because the population decline occurs in the second half of the century, and this shows why it is urgent to reduce emissions now. But this is something that we have so far been unable to do. Why?
The developed world (except for some outliers like the U.S., Canada, and Australia) have been reducing their per capita carbon footprint, but the global impact is limited because developed countries represent only 15% of the population. The problem is that the future of climate change is in the hands of developing countries, and their populations are still growing. Although the rate of population growth is falling, the size of the population of developing countries is so large that even a small percentage growth translates into billions more people. And they are also increasing their per capita energy consumption as they seek to achieve, if not parity with developed countries, at least better lives for their citizens.
We can’t rely on renewables to save the day because, despite triple digit growth, their starting point is so low that they cannot make much difference in the next three decades. For example, the EIA projects that renewables will provide half the world’s electricity in 2050. That sounds impressive until you realize that in 2050 delivered electricity will represent just 22% of total energy. Fifty percent of that is just 11% of all energy consumed.
So it seems that, sadly, our fate is to continue to fly headlong into the maelstrom we are creating, and that the only thing that will finally cause emissions to fall is a radical decline in the population caused by the disasters that will befall us as climate change continues along its inexorable path.
THE IMPACT ON CO2 CONCENTRATION AND GLOBAL MEAN SURFACE TEMPERATURE
The next chart shows global CO2 emissions and global CO2 concentrations from 1960 to 2019.
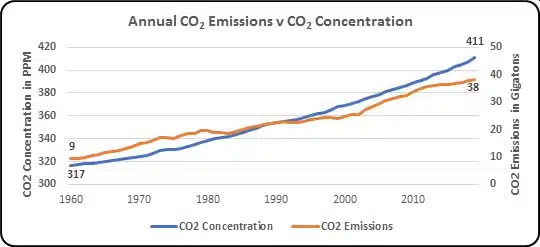
During this period, cumulative CO2 emissions were 1.37 trillion tons and the concentration of CO2 increased by 94 ppm. For every 14.5 billion tons of emissions the CO2 concentration increased by one ppm. Assuming that this ratio holds for future emissions, we can calculate that under the EIA/BP forecast where cumulative emissions are 3,475 billion tons, the concentration of CO2 will increase by 240 ppm by 2100. We’re now at about 412 ppm, so this would take us to 652 ppm. Under the climate change scenario where cumulative emissions are 2,645 billion tons, the concentration of CO2 will increase by 182 ppm, bringing us to a total of 594 ppm. The following chart compares the concentration levels.
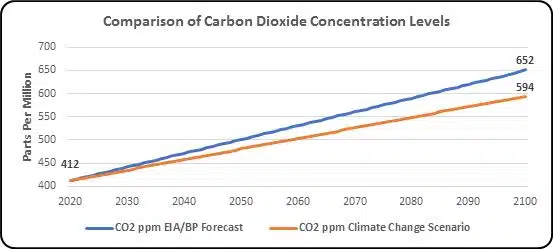
The climate change scenario reduces the CO2 concentration by 58 ppm.
The next chart shows the correlation between CO2 concentration and the global mean surface temperature (GMST) between 1960 and 2019.
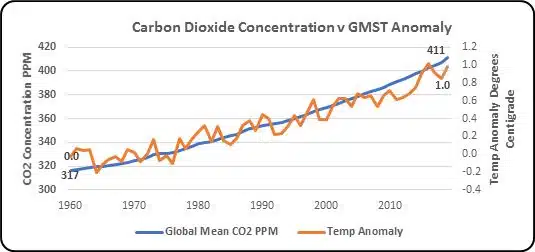
The 94 ppm increase in CO2 concentration corresponds to a .96 degree rise in the GMST. Using this ratio we can calculate that under the EIA/BP scenario, the temperature will rise by another 2.5 degrees Celsius, making the total temperature increase over 1960* 3.5 degrees Celsius by 2100. The temperature increase under the climate change scenario is 1.9 degrees Celsius, bringing the total temperature increase over 1960* to 2.9 degrees Celsius.
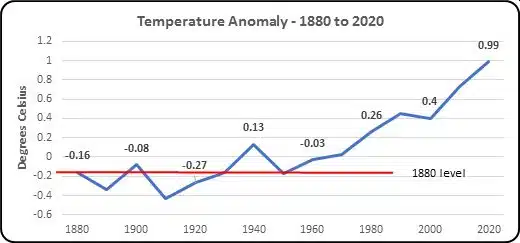
*The temperature increase is usually measured from 1880, considered the pre-industrial level. But as the following chart shows, there was a temperature drop during the early decades of the 20th century. The temperature only returned to the 1880 level in 1950, so all the temperature increase has occurred in the second half of the century. (Base period: 1951 – 1980.) See chart below.
The following chart compares the GMST based on the EIA/BP energy forecast to the GMST under the climate change scenario.
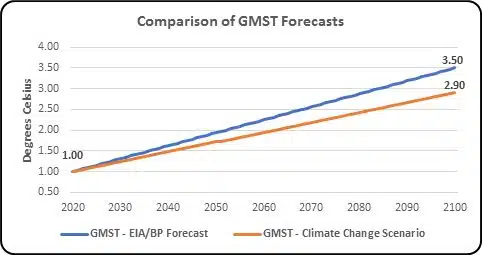
As you can see, even the colossal population decline during the second half of this century will not prevent catastrophic consequences from climate change.
A CAVEAT – INFRASTRUCTURE CHANGES REQUIRED
In order to change the entire energy infrastructure to electricity, substantial changes will need to be made to the global electric grid, including adding high voltage transmission lines to connect remote renewable power sources to the grid, adding distribution lines to service the new electric applications (like home electric heating and charging stations for electric vehicles), integrating networks, automating load-balancing, and integrating a distributed network of energy storage facilities for renewables.
In addition, the global infrastructure for heating, industry, and transportation will have to be completely replaced in order to convert them to electricity. This includes replacing the entire global fleet of internal combustion engines with electric vehicles.
A vast amount of money, time, and effort will be required, but progress must keep pace with the rollout of renewable and nuclear energy sources once they have met the current demand for electricity and begin to be applied to traditionally non-electric applications.
THE NEXT CENTURY
The population crash in the second half of the 21st century will continue into the 22nd century. How far it goes depends on how harsh the environment becomes and on how adept we are at finding ways to adapt and survive. It will take until the middle of the next century to see significant positive results from the emissions reductions of the second half of this century, so human population will likely continue to decline during the first half of the 22nd century. The next chart shows a possible scenario.
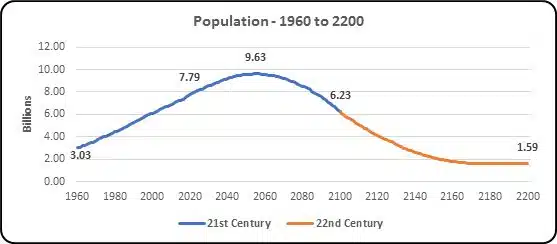
In this scenario, the global population stabilizes at around one and a half billion people. This is optimistic speculation. We don’t know how severe the impact will be. Assuming we eliminate fossil fuels in the first quarter of the 22nd century, we will still face rising temperatures due to Committed Warming – heat initially stored in the ocean following emissions and then later released into the atmosphere. And we will continue to face rising seas because the ocean temperature will not become cooler.
This raises this question: how many human beings can the planet support? The estimates vary widely, but if we think about it in terms of energy consumption, we can get a good idea. To be sustainable, the energy cannot produce greenhouse gas emissions. Pursuant to the climate change scenario, in 2100, nuclear and renewable resources will produce 158,000 TWh of energy (see chart #9). With a global population of 6.23 billion, the average per capita consumption of clean energy would be 25,400 KWh. This is less than the average per capita consumption by developing countries today and could probably not sustain a modern lifestyle. What would it require?
Today Japan is at 40,000 TWh, Germany and Austria are at 46,000 TWh, Italy is at 30,000 TWh, and Spain, Switzerland, and the UK are all around 35,000 TWh. Others that were previously mentioned (the U.S., Canada, and Australia) are much higher. With its large population, the U.S. has the greatest impact on emissions. Let’s assume that with effort, a modern lifestyle could be sustained with 40,000 TWh of energy per capita. This would mean that 158,000 TWh could sustain a population of about 4 billion people. This is not to say that the world cannot produce more than 158,000 TWh of clean energy, but the greater the energy demand, the longer it will take to eliminate fossil fuels. It appears that Mother Nature has run out of patience.
And finally, we have to consider emissions already in the atmosphere which continue to increase the temperature. Removing these emissions mechanically will take prodigious amounts of energy, which would have to be added to the other energy requirements. It may be more practical to do this by building up nature’s ability to photosynthesize, but this is a centuries-long enterprise. It’s highly speculative at this point, but conservatively, perhaps the maximum global population the planet can sustain while providing more than a subsistence existence for humans is around 2 billion.
THE INFECTION METAPHOR
When you get an infection the body activates its immune system and you run a fever. When it rids itself of the infection, the body’s temperature returns to normal. The weight of the bacteria required to cause an infection is infinitesimal compared to the weight of your body, yet it can wreak havoc and even kill the host it infects.
In the metaphor with climate change, the infected organism is the global biosphere and the infection is the human species, which weighs one ten thousandth the weight of the biosphere. The fever is global warming. The effect of global warming will be to eliminate the infection – us – unless, of course, we are able to sufficiently mitigate our noxious effects on the planet before that happens.
Because our impact is so abrupt, species do not have time to adapt, and many will go extinct. Many already have, and there’s no assurance that humans won’t. The biosphere will survive whether or not we do, although it will be changed. In retrospect, our impact on evolution will be akin to that of the asteroid impact that killed the dinosaurs. This was the Cretaceous -Tertiary extinction. It caused the extinction of at least 75% of all species.
ADDENDA
- A Word about Biofuels
The chart below shows the current percent of renewable energy by source.
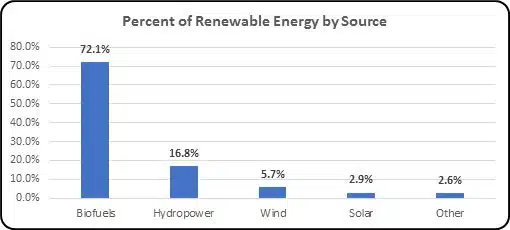
The lion’s share of renewable energy comes from biofuels, but biofuels don’t produce electricity. Their thermal energy is used for transportation. In order to achieve a 100% electric global energy system, we will have to replace them with nuclear and renewables. Currently biofuels are only 13% of total energy, so it won’t drastically change the picture. On the other hand, electricity may not be feasible for some applications. In this case, biofuels may be the answer. Against this, however, is the fact that agricultural yields will diminish as the global mean surface temperature rises, and this may force land that is used for biofuel production to be converted to the production of food crops.
- A Word About Hydroelectric Power
The average albedo of the terrestrial surface is 30%. The albedo of water is 6%. When reservoirs are created, the albedo of the area of the resulting reservoir is reduced which results in a positive radiative forcing effect, increasing global warming. This is offset by the fact that hydroelectric power does not generate CO2 emissions, but it may take a few years to a few decades to achieve a breakeven point, depending on the environment where the dam is located. Since we need to reduce radiative forcing as quickly as possible, this must be considered when evaluating the cost/benefit of new hydroelectric dams.